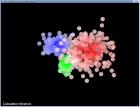
Result of clustering using hard k-means algorithm with k=3 on a data set of 1000 data samples.
|
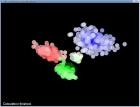
Same as previous - rotated view.
|
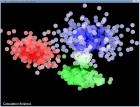
Same as previous - rotated and zoomed-in view.
|
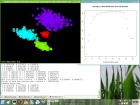
Screenshot of my desktop running the mixture-models clustering on the same data set as before, searching four clusters. Visible are the visualization GUI, the output on the command line and a display of the entropy of the data distribution over the clusters.
|

Same results as in the whole-screen shot, data points not displayed. Visible are the cluster center representations and their trajectories.
|
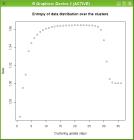
Display of the entropy of the data distribution over the clusters. For every data point there is a probability distribution over the different clusters. Depicted is the average entropy of these distributions. Needs the RPy module and an installation of R.
|

Three different points in time of the clustering process. The dynamics of the process become visible. Time point = 20.
|

Three different points in time of the clustering process. The dynamics of the process become visible. Time point = 29.
|

Three different points in time of the clustering process. The dynamics of the process become visible. Time point = 35. This was the final step. Convergence was reached in it.
|